Organizing Ideas Into Common Themes
Is it ever a bad thing to have too many ideas?
Probably not, but if you've ever experienced information overload or struggled to know where to begin with a wealth of data you've been given, you may have wondered how you can use all of these ideas effectively. When there's lots of "stuff" coming at you, it is hard to sort through everything and organize the information in a way that makes sense and helps you make decisions.
Whether you're brainstorming ideas, trying to solve a problem or analyzing a situation, when you are dealing with lots of information from a variety of sources, you can end up spending a huge amount of time trying to assimilate all the little bits and pieces. Rather than letting the disjointed information get the better of you, you can use an affinity diagram to help you organize it.
Also called the KJ method, after its developer Kawakita Jiro (a Japanese anthropologist) an affinity diagram helps to synthesize large amounts of data by finding relationships between ideas. The information is then gradually structured from the bottom up into meaningful groups. From there you can clearly "see" what you have, and then begin your analysis or come to a decision.

Affinity diagrams can be used to:
- Draw out common themes from a large amount of information.
- Discover previously unseen connections between various ideas or information.
- Brainstorm root causes and solutions to a problem.
Because many decision-making exercises begin with brainstorming, this is one of the most common applications of affinity diagrams. After a brainstorming session there are usually pages of ideas. These won't have been censored or edited in any way, many of them will be very similar, and many will also be closely related to others in a variety of ways. What an affinity diagram does is start to group the ideas into themes.
From the chaos of the randomly generated ideas comes an insight into the common threads that link groups of them together. From there the solution or best idea often emerges quite naturally. This is why affinity diagrams are so powerful and why the Japanese Union of Scientists and Engineers consider them one of the "seven management tools."
Affinity diagrams are not the domain of brainstorming alone though. They can be used in any situation where:
- The solution is not readily apparent.
- You want to reach a consensus or decision and have a lot of variables to consider, concepts to discuss, ideas to connect, or opinions to incorporate.
- There is a large volume of information to sort through.
Here is a step-by-step guide to using affinity diagrams along with a simple example to show how the process works.
How to Use the Tool
- Describe the problem or issue:
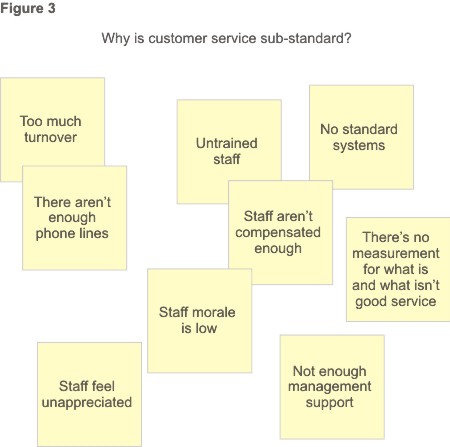
- Generate ideas by brainstorming. Write each idea on a separate sticky note and put these on a wall or flip chart. Remember to:
- Emphasize volume.
- Suspend judgment.
- Piggyback on other ideas.
- Emphasize volume.
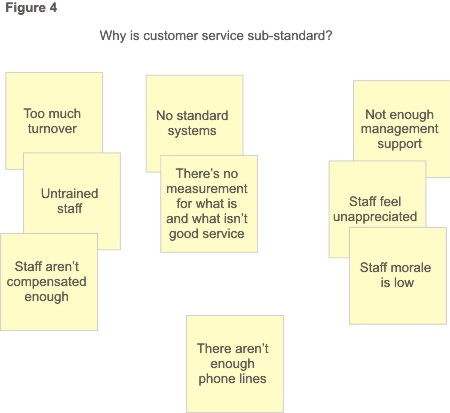
- Sort ideas into natural themes by asking:
- What ideas are similar?
- Is this idea connected to any of the others?
If you're working in a team:
- Separate into smaller groups of 3 to 4 people.
- Sort the ideas IN SILENCE so that no one is influenced by anyone else's comments.
- Keep moving the cards around until consensus is reached.
- What ideas are similar?
- Create total group consensus:
- Discuss the shared meaning of each of the sorted groups.
- Continue until consensus is reached.
- If some ideas do not fit into any theme, separate them as "stand-alone" ideas.
- If some ideas fit into more than one theme, create a duplicate card and put it in the proper group.
- Try to limit the total number of themes to between five and nine.
- Discuss the shared meaning of each of the sorted groups.
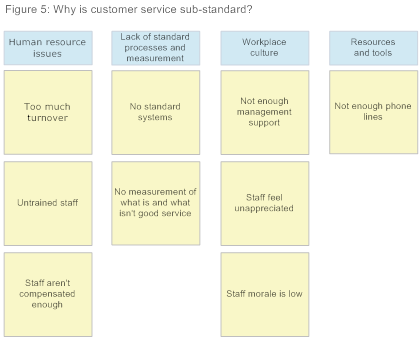
- Create theme cards (also called affinity cards or header cards):
- Create a short 3-5 word description for the relationship.
- If you're working in a group, do this together, out loud.
- Write this theme/header on a blank card and place at the top of the group it describes.
- Create a "super-headers" where necessary to group themes.
- Use a "sub-header" card where necessary as well.
- Create a short 3-5 word description for the relationship.
| Drawn using SmartDraw. Click for free download. |
- Continue to group the themes/headers until you have reached the broadest, but still meaningful, categories possible:
- Draw lines connecting the super-headers, themes/headers, and sub-headers.
- You'll end up with a hierarchical structure that shows, at a glance, where the relationships are.
- Draw lines connecting the super-headers, themes/headers, and sub-headers.
| Tip: Grouping ideas under headings, and then grouping headings under super-headers in an affinity diagram is a practical way of "chunking" information generated in brainstorming sessions, during process mapping, or even a planning exercise. Click here for more information on Chunking. |
Key Points
Affinity diagrams are great tools for assimilating and understanding large amounts of information. When you work through the process of creating relationships and working backward from detailed information to broad themes, you get an insight you would not otherwise find.
The next time you are confronting a large amount of information or number of ideas and you feel overwhelmed at first glance, use the affinity diagram approach to discover all the hidden linkages. And when you cannot see the forest for the trees, an affinity diagram may be exactly what you need to get back in focus.
انشر هذا الخبر فى صفحتك على الفيسبوك


No comments:
Post a Comment